Hi guys,
In this entry we are going to perform a degradation test to Varicore cell NCR18650B, so we will know what the lifespan of this cell is.
What is the degradation test
We will perform charge and discharge cycles continuously, and measure every 30 complete cycles, the actual capacity left to the cell. The steps to follow are as follows:
- We’ll make a first measurement of the capacity of a completely new Varicore NCR18650B cell with the Opus BT C3100 battery charger
- We will perform 30 complete cycles with the home tester of load cycles for cells 18650
- We re-measure capacity with the Opus and record the degradation that the cell has suffered
- We repeat step 2 and 3 again until we reach 500 complete cycles
The home load cycle tester for 18650 cells will calibrate it exactly as we did with Liitokala’s NCR18650B cell (Liitokala NCR18650B degradation). The parameters are as follows:
- Charging voltage: 4.19V
- Discharge voltage: 2.85V
- Charging current: 1A
- Discharging current: 2A
This means, the cell will load up to 4.19V, then it will download up to 2.85V, and reload again (so on)
I leave you the links where I bought these cells and the Opus loader:
We begin the study of degradation
As a starting point we have a completely new cell model NCR18650B from Varicore.
Below is a photo with the actual capacity from which we start, measured with the OPUS:
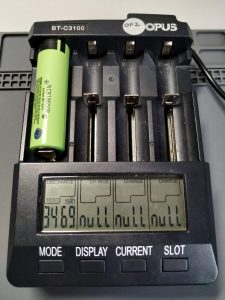
As you can see in the image, the cell has given an initial capacity of 3,469 mAh, which is very good.
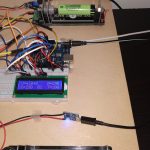
Now let’s go perform the continuous charges and discharges with the load cycle tester. I leave you a picture of the device:
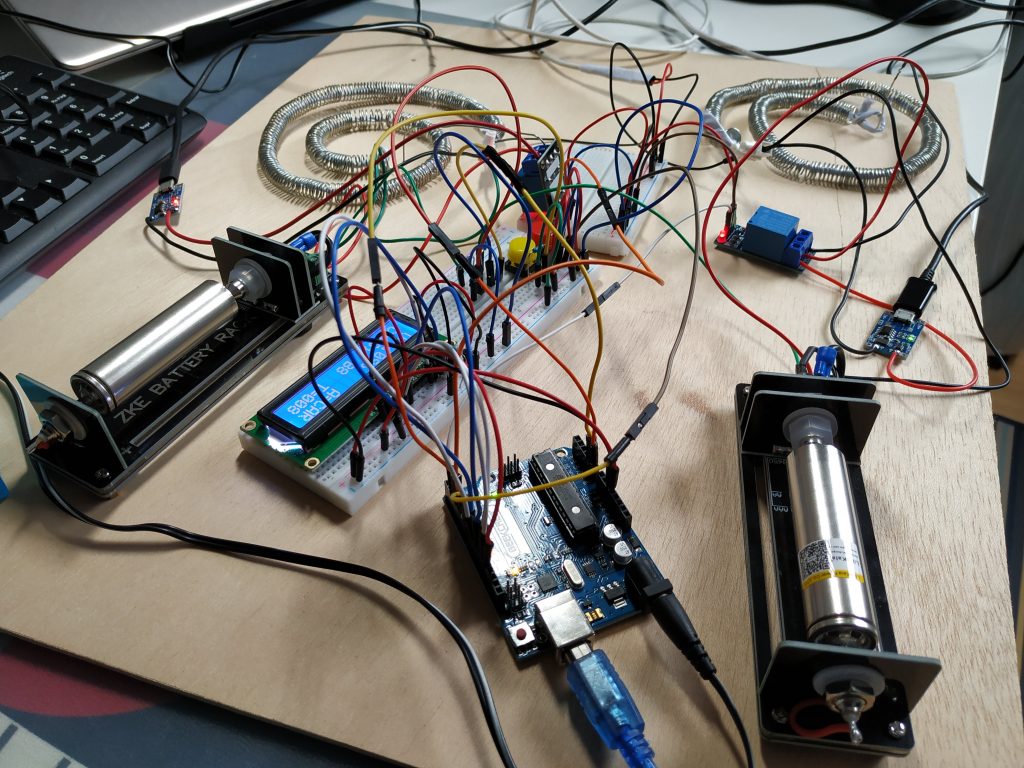
As you can see, I have prepared it to be able to carry the charges/discharges to two cells simultaneously. This allows me to continue with Liitokala’s NCR18650B degradation test and at the same time start with this test.
Test results table
I leave you a table where you can go see the results of the test. I’ll update it as you get new data:
| Date | Cycles | Capacity (mAh) | Observations |
| 16/03/2020 | 1 | 3469 | Starting point |
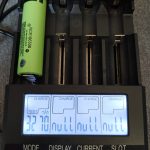
| 24/03/2020 | 30 | 3270 | Loss of 5.73%!! Could it be that the initial value is inflated in any way by the manufacturer? We’ll see how it degrades from here on out. |
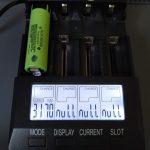
| 01/04/2020 | 60 | 3170 | Loss of 8.61%. In these 30 cycles it has lost a lower percentage than previously, but is still higher than that of Liitokala cells. They are getting closer and closer in capacity, although for the moment it still surpasses that of Liitokala. |
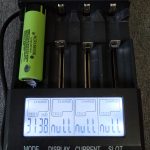
| 07/04/2020 | 90 | 3138 | Loss of 9.54%. Degradation is getting smaller and smaller. He looks a lot better this cell. |
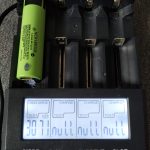
| 14/04/2020 | 120 | 3071 | Loss of 11.47%. |
| 20/04/2020 | 150 | 2997 | Loss of 13.60%. |
| 28/04/2020 | 180 | 2931 | Loss of 15.50%. |
| 06/05/2020 | 210 | 2880 | Loss of 16.97%. |
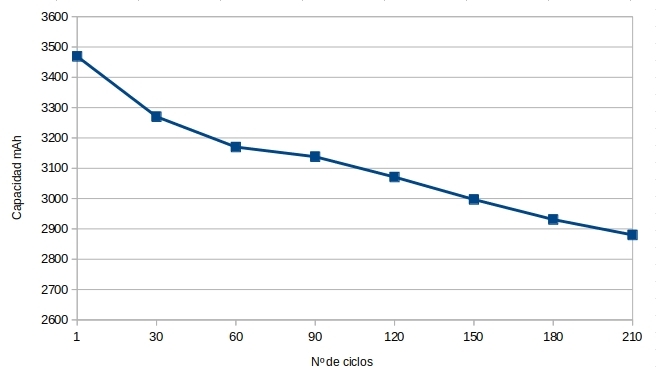
I leave you a graph with the result to see it more simply. I’ll update it with the new readings:
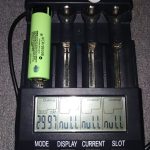
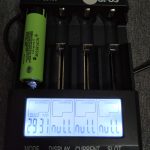
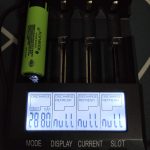
Photos of the capabilities obtained in each test:
I will continue to update the data, at least up to 500 full cycles. I hope you find this data useful. Any question, leave it in comments.
Thank you and regards!






After some research i found out that all lithium batteries have a large first cycle loss (5%) but the first cycles is usually done at the production factory…
I wonder if these cells were maybe marked as defective at the factory floor and were sold off before getting cycled for the first time…
Can you test a new Varicore battery to see the degradation from the 1st cycle and not the first 30? if we see 5% loss from the first i could be that…
on second thought the % drop is mostly due to the starting point being much higher, the mah difference at 210cycles is only 2922-2880 = 42mah
will be interesting to see how they compare at ~500 or higher cycles to see the true longevity
Interesting, it’s degrading much faster than the liitokala